How I scrape and analyse Twitter networks
This how-to report is to assist those conducting research on information operations or performing a network analysis on Twitter. It may also be useful to those seeking to hunt bots, track automation, capture breaking events or learn how to scrape data.
Because many have asked about this from varying pockets of the world, I have made sure all of the resources in this analysis are free.
I have broken this research down into three sections. They are based on how I conduct my network analysis, so a preliminary research stage, getting data and presenting the data.
- Research preparation. Past information operation case studies, identification of a trend, monitoring hashtags in Tweetdeck, and what data you need for a network visualisation
- Essential raw data. Tools to capture data from Twitter, capturing data using Python, converting captured data to graph, location capture, and capturing data using Twitter’s API
- Cooking the data and presenting it in Gephi. Displaying visualisations, organising nodes into clusters, analysis in the Data Laboratory, and running a brief analysis of accounts
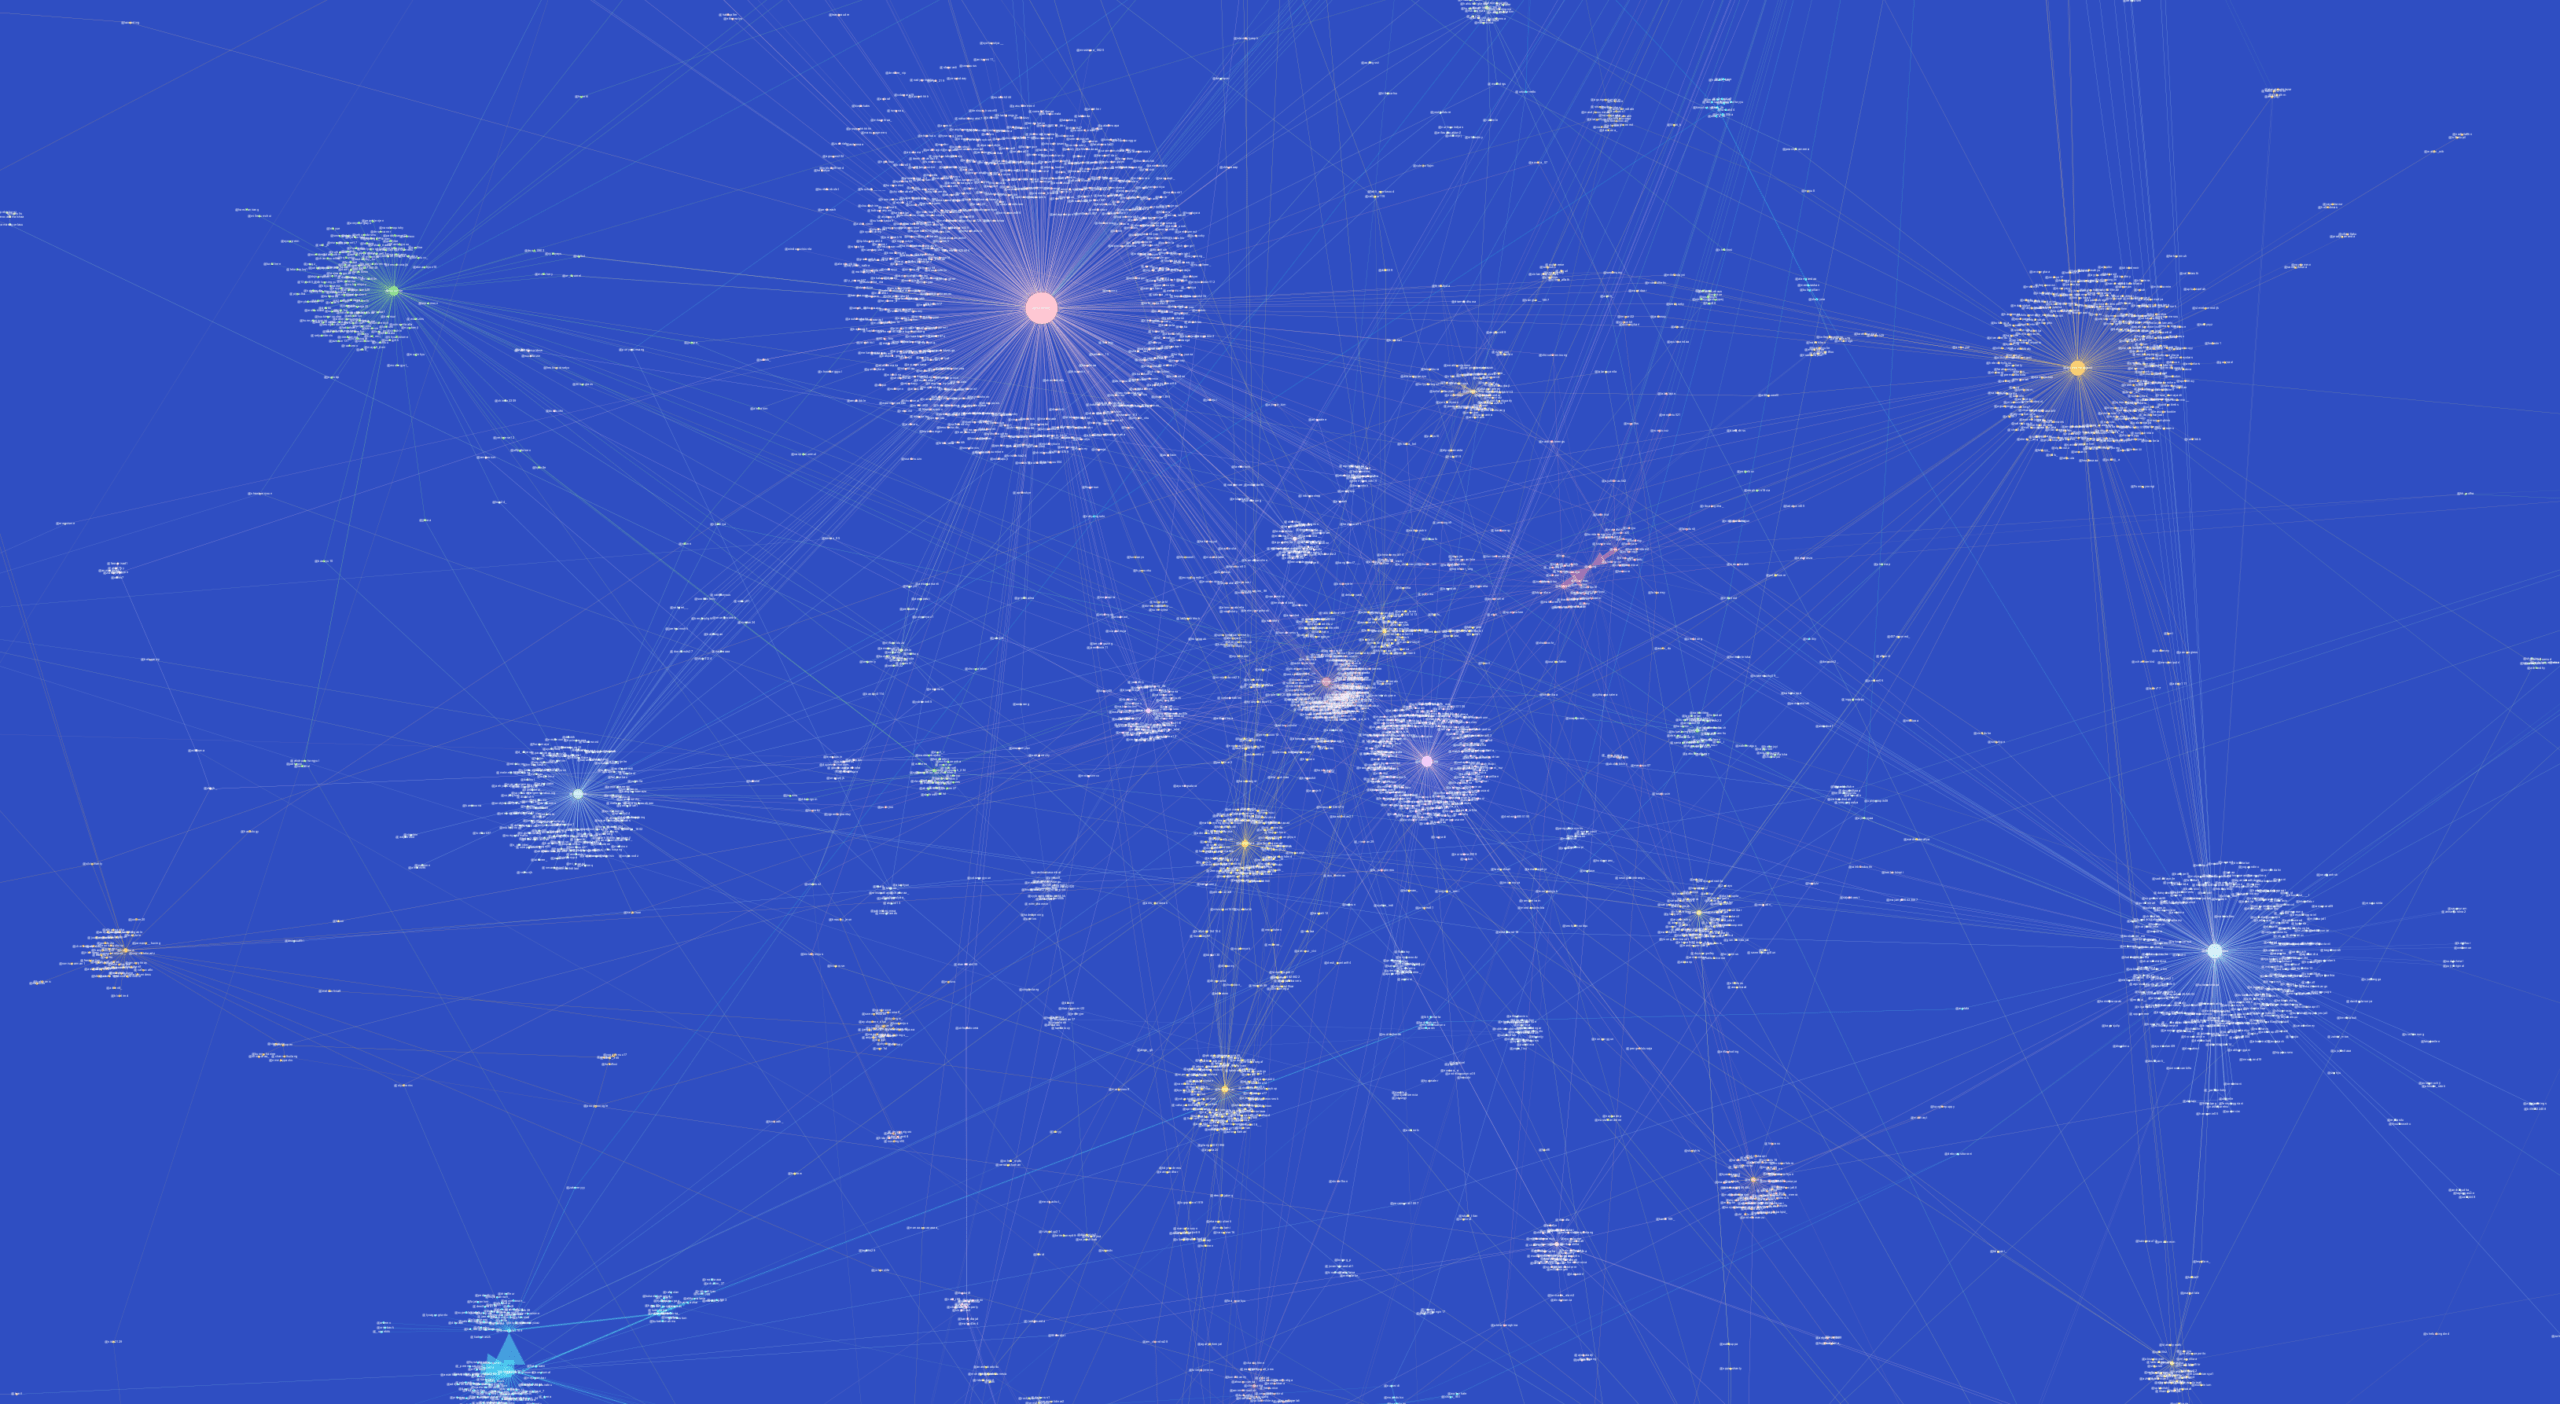
For the purpose of this report, I chose to use a dataset I worked on in 2019 on the #bolivianohaygolpe network. The data captured was based on a prominent hashtag used in the context of a coup in Bolivia at the time.
If you would like to follow along with this how-to approach with your own data, please do.
Research preparation
Before we start scouring the entire internet looking for big networks, we need to know what we are looking for.
Simply put, we need to know thy enemy. We can do that by reviewing past case studies. These are best as we can follow someone’s experience down the rabbit hole of network analysis and get an understanding of how we might be able to tackle them in the future.
A struggle of researchers is the time it takes to monitor networks on Twitter. So in this section I have also given an insight into my setup for monitoring Twitter activity.
Past information operation case studies
Researching case studies that have been transparent about their research method can lead to a practical insight into how to identify information operations in the future. Two case studies I have published on this are:
- China network: Uncovering a pro-Chinese government information operation on Twitter and Facebook: analysis of the #MilesGuo bot network
- West Papua network: Investigating information operations in West Papua: a digital forensic case study of cross-platform network analysis
Both of those investigations originated out of the capture of a network and analysis of the dataset. Subsequent investigations sought to identify, where possible, the origins of the information campaign and those behind it.
Identification of a trend
So how do we find suspected networks? The answer: become familiar with the platform and how these networks operate by looking at the data of past takedowns.
Learning about past networks gives you a general knowledge of information operations, such as their aim, appearance, and more importantly, where you might find them. There are a number of resources online to get into the data of past information operations on Twitter. Below are some:
- Twitter Transparency Report, data on information operations, very detailed including datasets on networks as well as the media they used
- Stanford Internet Observatory Cyber Policy Center
- Graphika Reports
- DFRLab on Medium
- EUvsDisinfo Reports
- Australian Strategic Policy Institute, International Cyber Policy Centre
- Bellingcat reports on bot networks
But what about that magic question: how do we find them? Well, the first step starts with paying attention to the world of Twitter and what is being said. One way I tackle that problem is by monitoring hashtags in Tweetdeck.
Monitoring hashtags in Tweetdeck
The monitoring of hashtags is important in being able to detect when there might be automation, or a coordinated effort to either shift the narrative of a subject, or boost a specific topic.
You might be wondering why I keep mentioning automation. An automated Twitter account is not always bad, there are actually some pretty fun automated accounts on Twitter. But when there is an army of fake accounts automating a political issue, community sensitivity, or attacking a company, then there is smoke and fire.
For monitoring specific hashtags on Twitter, I like to use the monitoring functionality of Tweetdeck. Simply add a hashtag using the search style of column.
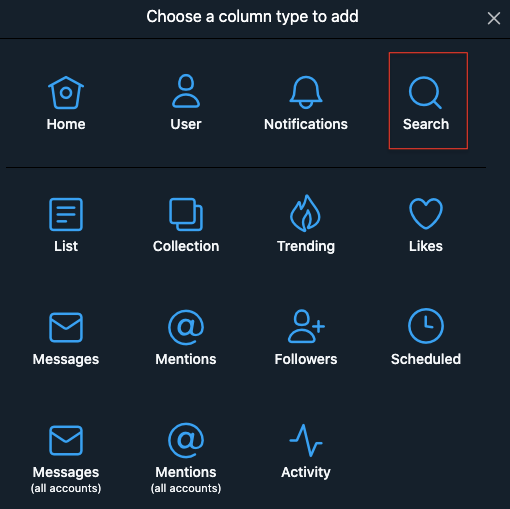
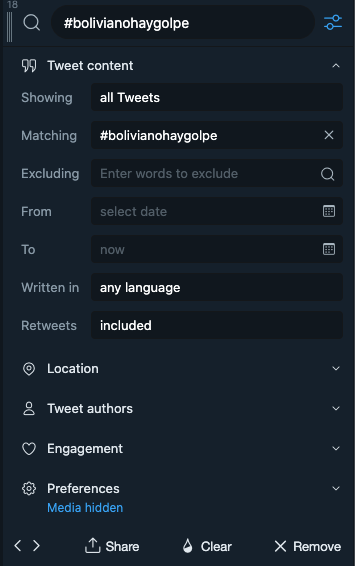
This will give you a column which you can customise with content settings to choose specific languages, date range, tweets with only images and filtering out retweets.
When looking at networks not all of them use hashtags. Some might instead use a specific string of words or letters in their content, so you could use that as your monitoring list.
Anything you can identify that is unique to a subject you want to monitor is a starting point to pivot into data collection for analysis. In the case study I was monitoring the tag #bolivianohaygolpe, which loosely meant "no coup in Bolivia". There was an abundance of tweets using this same tag, so it was the common link for me to use what tools I had available to monitor the trend.
Any common link you can identify is a great starting point to look at what data you want to collect, or scrape. For example, a propaganda operation targeting West Papua was captured using only three tags. I captured five days of tweets using #WestPapua and #FreeWestPapua after a crackdown by Indonesian forces against Papuans in August. What I found was a bot network spreading pro-government propaganda.
This has been the key starting point for most of my investigations and often the hardest, but once found, then follows a sequence of logical steps to identify the possible network.
What data do you need for a network visualisation?
Before we get into the details of exactly how to capture data from Twitter, we first need to identify what we require to make a network visualisation.
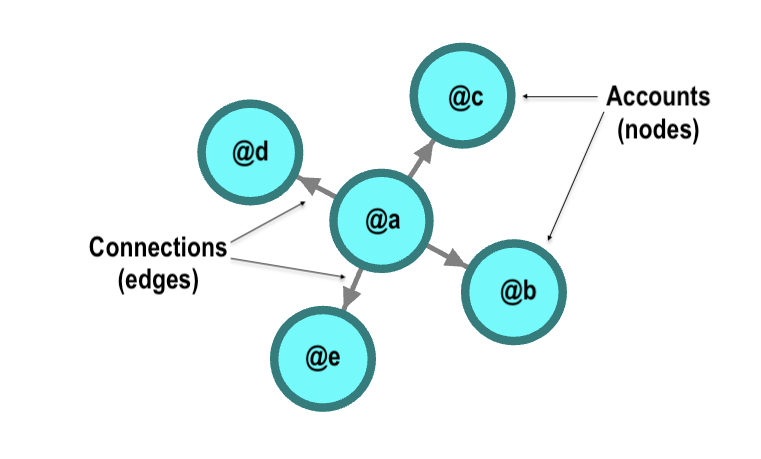
In the cluster above we have Twitter accounts identified by their handles @a, @b, @c, @d, @e. In a network, these are called nodes. Connecting them are the connections, referred to in a network as edges. In this case, the edges are going outwards. That means Twitter account @a tweeted and mentioned @b, @c, @d and @e.
If you wanted to see those labels in a Gephi format, you would need a nodes table holding individual account information.
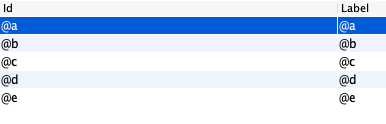
Please note, this is a very simple description of a small network of five accounts. There are books, courses and far more in-depth resources on network theory and analysis.
Also, much larger networks will not just be lists of account names. For a more in-depth analysis you will need attribute tables such as account creation date, weight and hashtags used, all of which will be covered further down in this report.
But what this smaller network does give us is the essential criteria of what a network looks like in CSV format when read as a spreadsheet table. The columns that hold the data you capture will define the links made between rows of a sheet.
Getting the essential raw data
In this section I am going to cover tools I find essential to capture data. It will provide two alternatives on how I capture that data: Twitter scraping with Python, and using Twitter’s API. This section will also cover how to sort raw data into a file that is friendly for processing in a visualisation platform like Gephi.
These are two tools I use to capture data from Twitter:
- Python script Twint, in conjunction with Table2Net to sort data
- Gephi with TwitterStreamingImporter and the Twitter API
Capturing data using Python
Python is a general purpose programming language. There is an abundance of Python programs that are capable of collecting data from platforms, however in these case-use scenarios I use Twint.
Twint is described as an advanced Twitter scraping and OSINT tool written in Python that does not use Twitter’s API, allowing you to scrape a user’s followers, following, tweets and more while evading most API limitations. It is made by Francesco Poldi and is easy to use when requested through the command line.
Basically, what this does is remove the reliance upon buttons for using Twitter. Instead, we get to glimpse into the realms of user-generated data.
For the case study, the tag I was looking into was #bolivianohaygolpe, so a simple command in Twint allows me to pull all of the tweets that used the hashtag:
The same process can also be used to scrape mentions of a specific account. For the #bolivianohaygolpe campaign, many of the tweets mentioned former President of Bolivia Evo Morales. This was either through replies to his tweets or through mentions of his Twitter handle @evoespueblo. I used the following command to collect all mentions of his handle:
For further analysis of Evo Morales followers, we can use a command such as the one below. This provides full follower information: name, handle, verification, account creation date, followers, following, bio, location and more. But be warned, it is a much slower process than the previous command, so you might want to make a cup of tea while you are waiting.
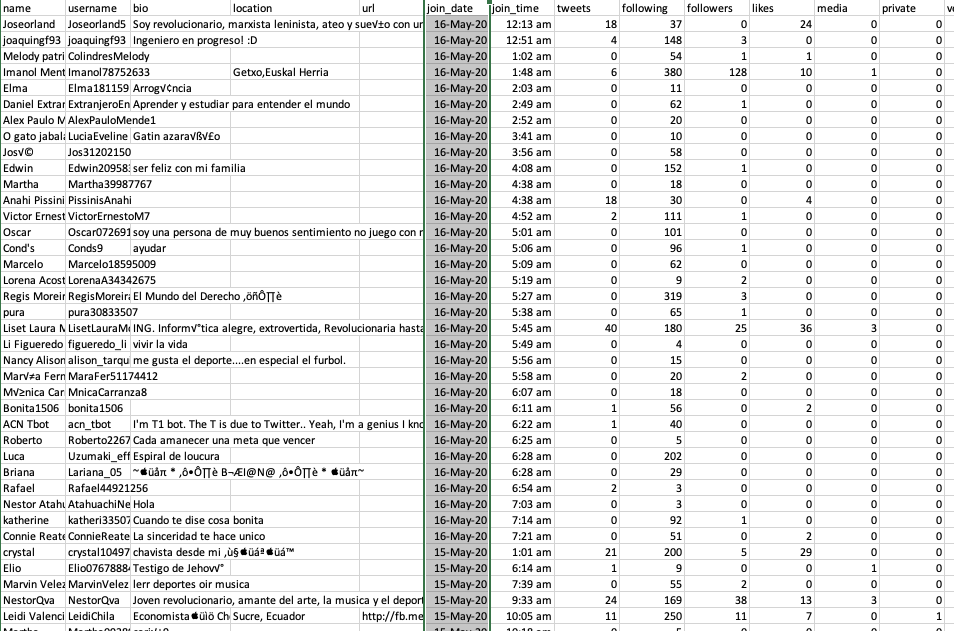
Using a filtering feature by column in Excel, we can sort the data by values. I always like to check out account creation dates, as they are indicative of odd behaviour when there is a massive bunch made on one day.
This method of capturing and analysing the data is useful for identifying trends such as account name generators, same account creation dates and automated posting times, which can all follow a strong pattern if automation is present.
Converting captured data to graph
It is possible to convert scraped data into a format friendly for network visualisations. This can be done by using the tool Table 2 Net. Twitter user @hpiedcoq introduced me to this tool as a way to sort data into network-friendly lists, and it is quite reliable for that use.
First, when you upload the CSV it will sort the data into columns. I like to display this as a network based on citations. For the following sections I set my nodes as account names and comma separated, links are mentions as that is the command I requested in the scrape, then build the network.
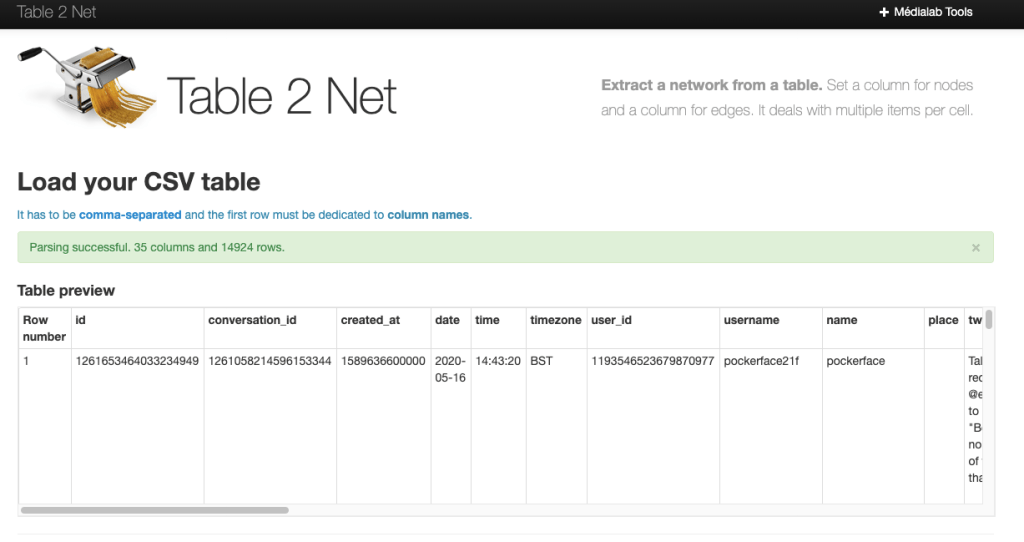
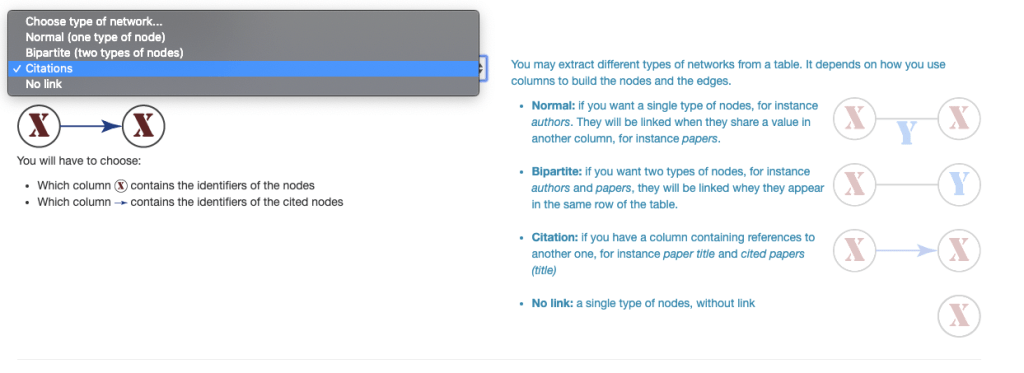
Of course, you can set attributes so that once you have your visualisation you can identify different patterns in your nodes. Once you have built that network, it will provide you with a GEXF file which you can upload straight to Gephi, or another visualiser.
Location capture tweets to graph
If you are reading this and a bit lost, something else you can try right now is making a network-friendly file out of geotagged tweets. For this example, I thought it would be fun to try out tweets geotagged to Canary Wharf in London. There are lots of interesting people, places and things there. We can get the coordinates from Google Maps, then use Twint:
This will give you a dataset of tweets tagged in a specific location, of which you can either manually column sort, or use in Table2Net and Gephi.
Capturing data using the Twitter API
In order to use Gephi with the plugin TwitterStreamingImporter you must have developer access to the Twitter platform and generate an API key. The TwitterStreamingImporter was developed by Matthieu Totet. To install it, simply access it through the Gephi plugin panel. Should you need assistance in setting up an API key, the team behind it have a complete step-by-step guide here.
The function I use the most is to pull data based upon words to follow, much like what we did through the command line before. This is just an alternative, and easier, way.
The network logic I choose is generally user network. The user network is based on the interaction between users, so any mention, retweet or quote will be captured and represented automatically in Gephi. For the others, hashtag network will create a network of tags, emoji network is for emojis. The full option is also very useful for individual accounts, as it is a network using all Twitter activity: tweets, tags, URLs and images.
When you first click connect, it will start pulling activity as it happens through the API. Depending on the word you choose, it may either take a long time as each tweet is made with that word, or alternatively it will crash your computer in minutes with overwhelming data.
Cooking the data and presenting it in Gephi
The past two sections focussed on where to find possible inauthentic networks, the data you need to create a small network, and how you can scrape data from Twitter. This section now focuses on processing that data in a visualisation platform so that you can visually analyse it.
In this section I have relied primarily on the use of open source platform Gephi. While there are other visualisation methods out there, this is one that I find reliable and flexible. An alternative visualisation platform I can recommend is Graphistry.
How I display network visualisations
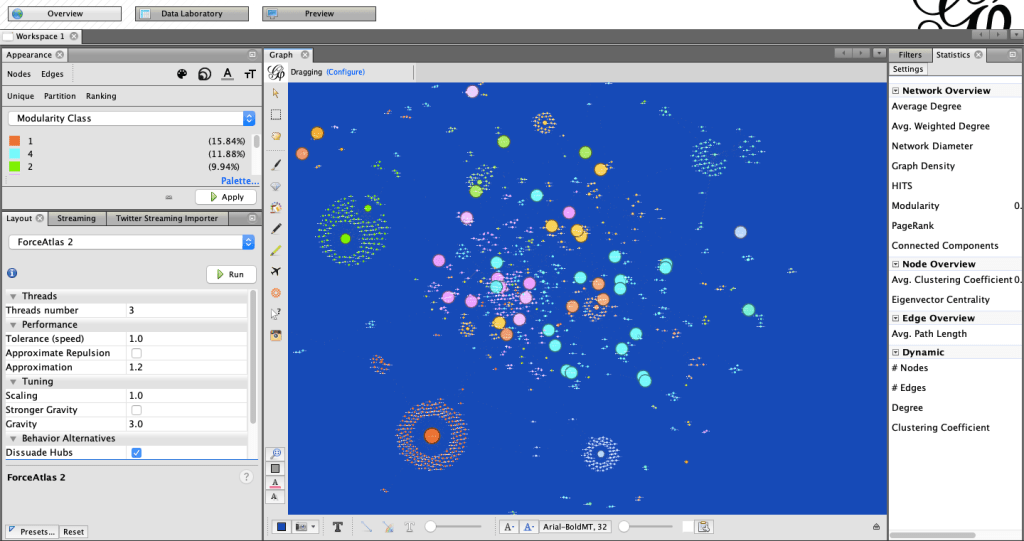
Starting with a clean, unprocessed block of data, there are a lot of things we can do in Gephi. First, I always like to break up the data using one of the layout functions. Dissuading hubs and preventing overlap allows for a more constructive analysis and visualisation.
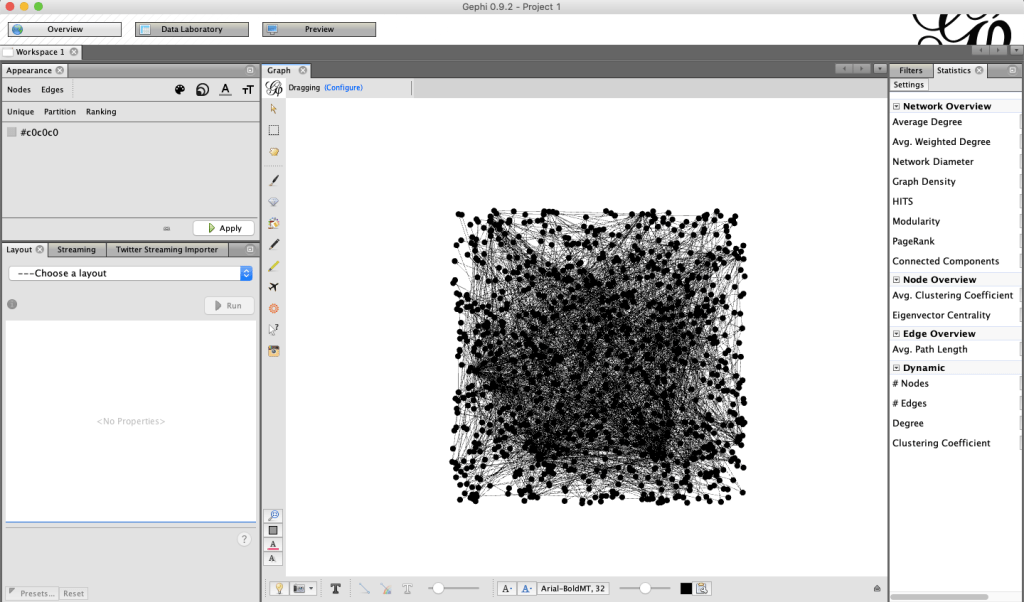
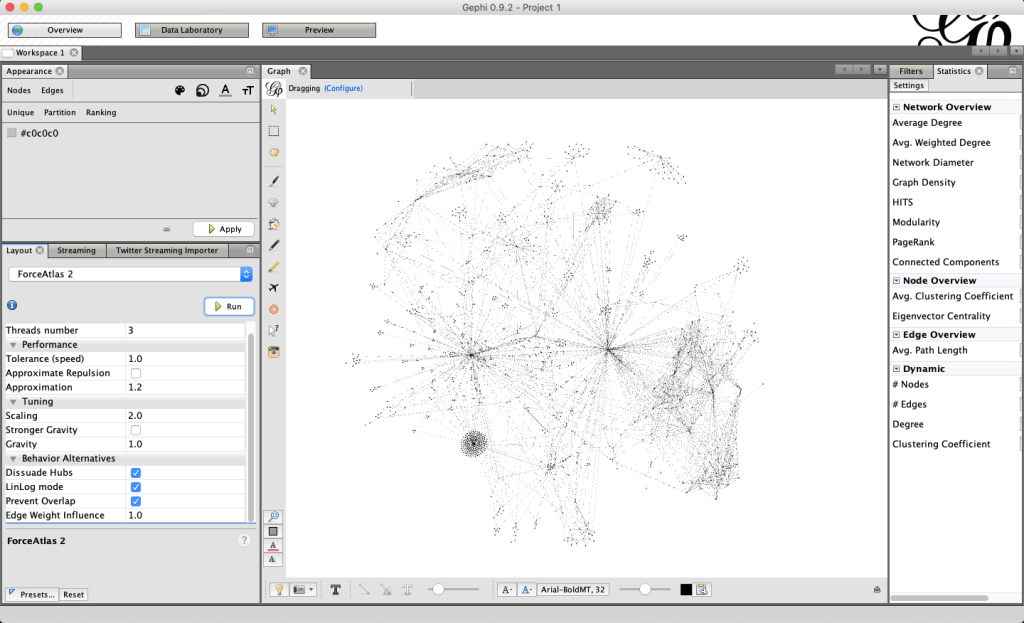
This is your basic representation of the data with quick processing, but it can look much nicer than that.
How I organise nodes into clusters
Once you have displayed your network, it is time to classify clusters with the modularity algorithm. The purpose of this is so you can then automatically apply individual colouring to each cluster. Doing so will issue you with a modularity report which often has quite interesting details for analysis.
What we are able to do now is use the partition colouring panel to partition the nodes based on modularity class and apply a palette to them. Depending on the palette you choose you might want to change the background colour.
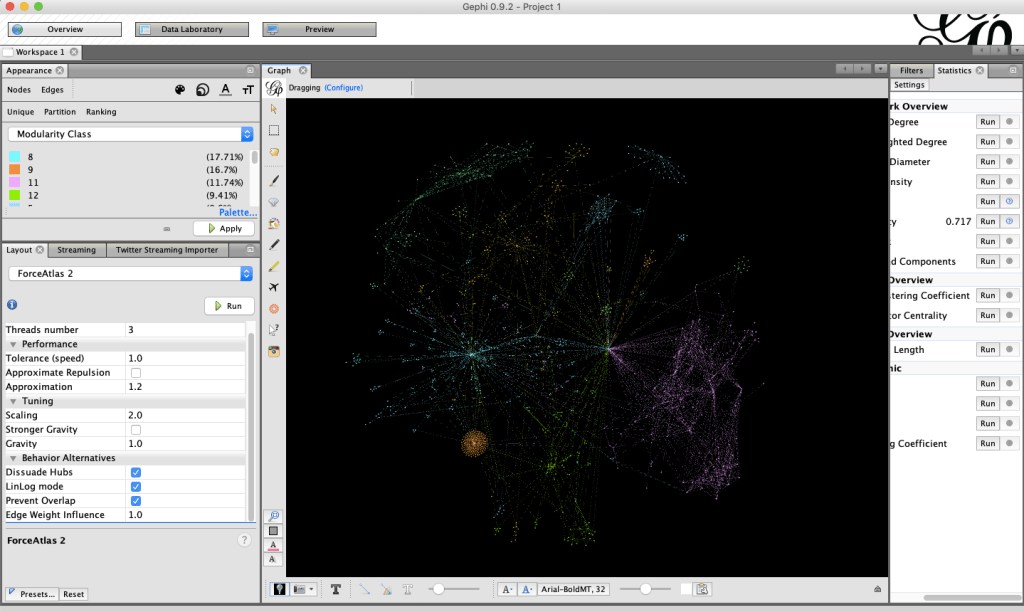
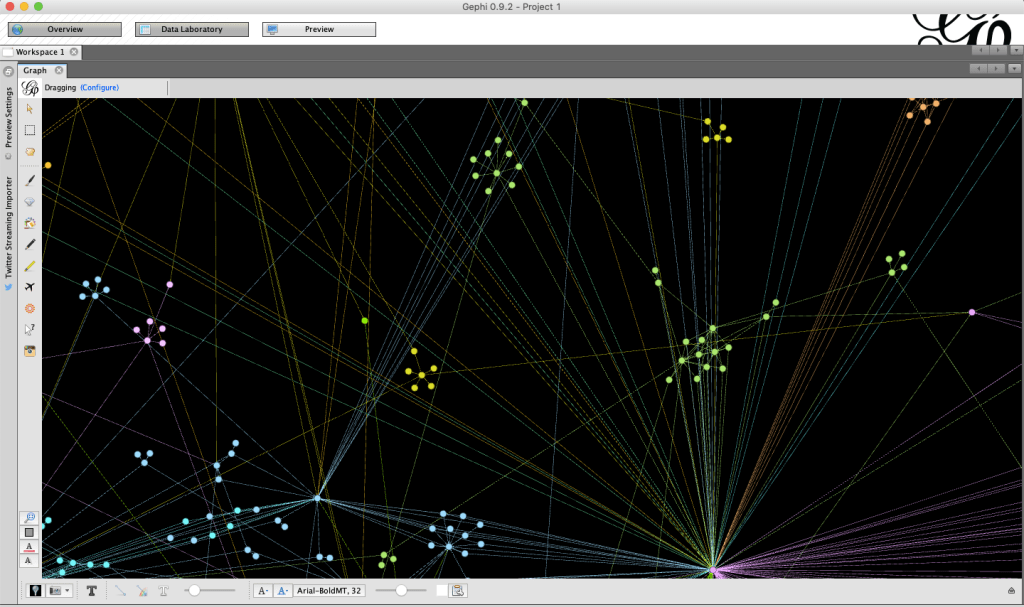
There are many ways to display Gephi data for analysis. This is just one method I have outlined.
Analysis in Gephi’s Data Laboratory
The benefit of using the TwitterStreamingImporter plugin in Gephi is that while data is being pulled into your visualisation through the API in real time, you can also conduct an ongoing analysis of accounts and trends in the network as it happens.
As I mentioned in some of the beginning sections, one of the things that is important to look for in identifying possible networks is the account creation date, which the Data Laboratory, much like a spreadsheet, allows you to sort through for visual pattern identification.
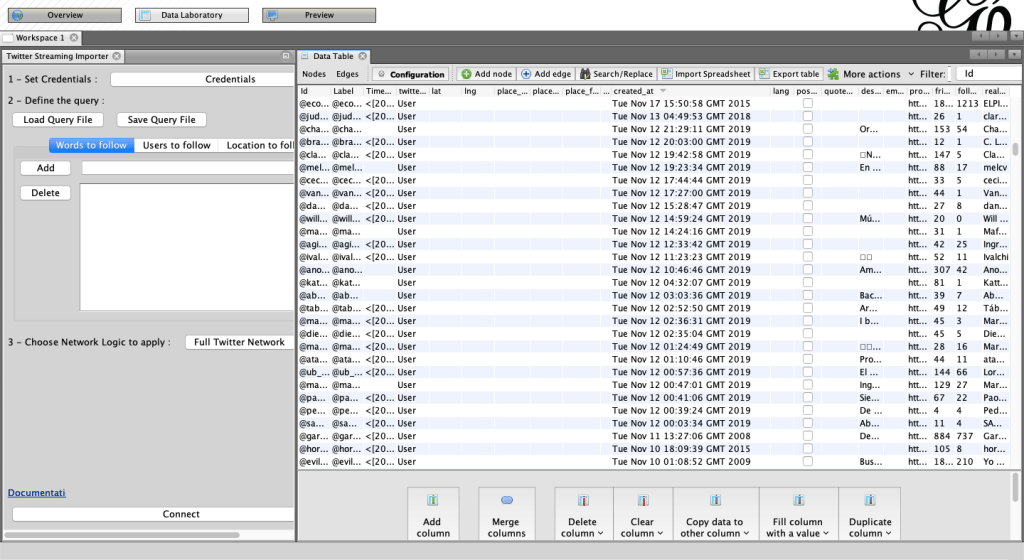
As seen above, we can tell that on 11 and 12 November 2019, many of the accounts in the #bolivianohaygolpe network were created. To show them clearly, we can bulk edit the node size. This gives a direction as to what accounts need further investigating and allows us to focus our analysis time.
In some cases, using the Data Laboratory may also indicate signs of automation in the posting times. These can occur as patterns. On any given day there are set patterns the bots work on. It is automated but still runs on a programmed pattern, and you can see that in the pattern of post times.
This, however, is only a starting point with the data. It draws the difference from being able to collect and present data, to pivoting on the results found and diving further down the analytical rabbit hole.
Running a brief analysis of accounts
While I did say the investigative task from here requires manual diving into clusters and accounts, there are some ways to automate the flagging of suspicious accounts and networks. Three tools I use for this purpose are Botometer, TwitterAudit, and image reverse search using the RevEye plugin.
Botometer is a joint project of the Network Science Institute and the Center for Complex Networks and Systems Research at Indiana University. Using it is very simple. It can work either through the user interface on the website, or in an application through the API. Note that it will also conduct a sentiment analysis, content evaluation and other factors. This is quite useful as it saves the time of a researcher conducting this analysis by hand.
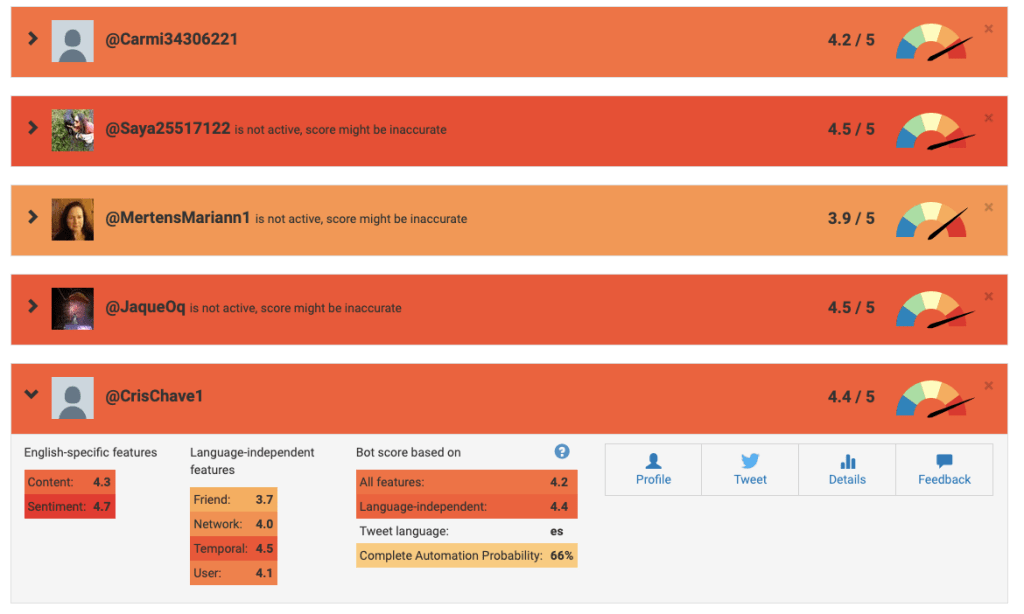
Something we can also do is run the same analysis on followers or friends of those accounts. This will automatically go through each one and conduct the same analysis.
TwitterAudit can show some insights on Twitter accounts with much larger follower numbers. For accounts in the public eye, it is quite common to have followers that might have been flagged as fake. The indicia for flagging as fake can include account age and whether the account posts, so a person’s account made for only reading Twitter but not participating could be flagged. This is why there should always be a human check in an investigation, rather than the reliance upon tools for a conclusive result.
Image reverse search is that human check. It involves simple logic, such as checking the origin of a profile picture. In the West Papua network, one bot account was caught this way, with Yandex image reverse search prevailing. Remember that these accounts were only caught after five days; the actual size of that bot network was much larger.
Concluding remarks
The content I have covered in this report provides an introductory knowledge of the who, where and what of information operations on Twitter, two alternative methods of scraping data involving Python or Twitter’s API, and presenting that data in a visualisation platform.
Please do note that there may be alternative ways of looking at this data and different tools, however I have kept this report limited to the tools I have used in successful information operation detection cases.